What is purchasing power parity? ★
Many economic statistics seem conceptually simple, but are rather intricate and technical as actually measured (or more accurately, constructed). You can’t just line up dollars of GDP and count them. Price indices are similarly fiendish.
Conceptually, the purchasing power parity exchange rate between two countries is simply the relative cost, in local currency units, of buying the same basket of goods in each country. This can be very different from the market exchange rate, but is generally a better way to convert, say, GDP per capita, if you’re interested in cross-country comparisons of welfare (GDP? welfare? we’re already on shaky ground…)
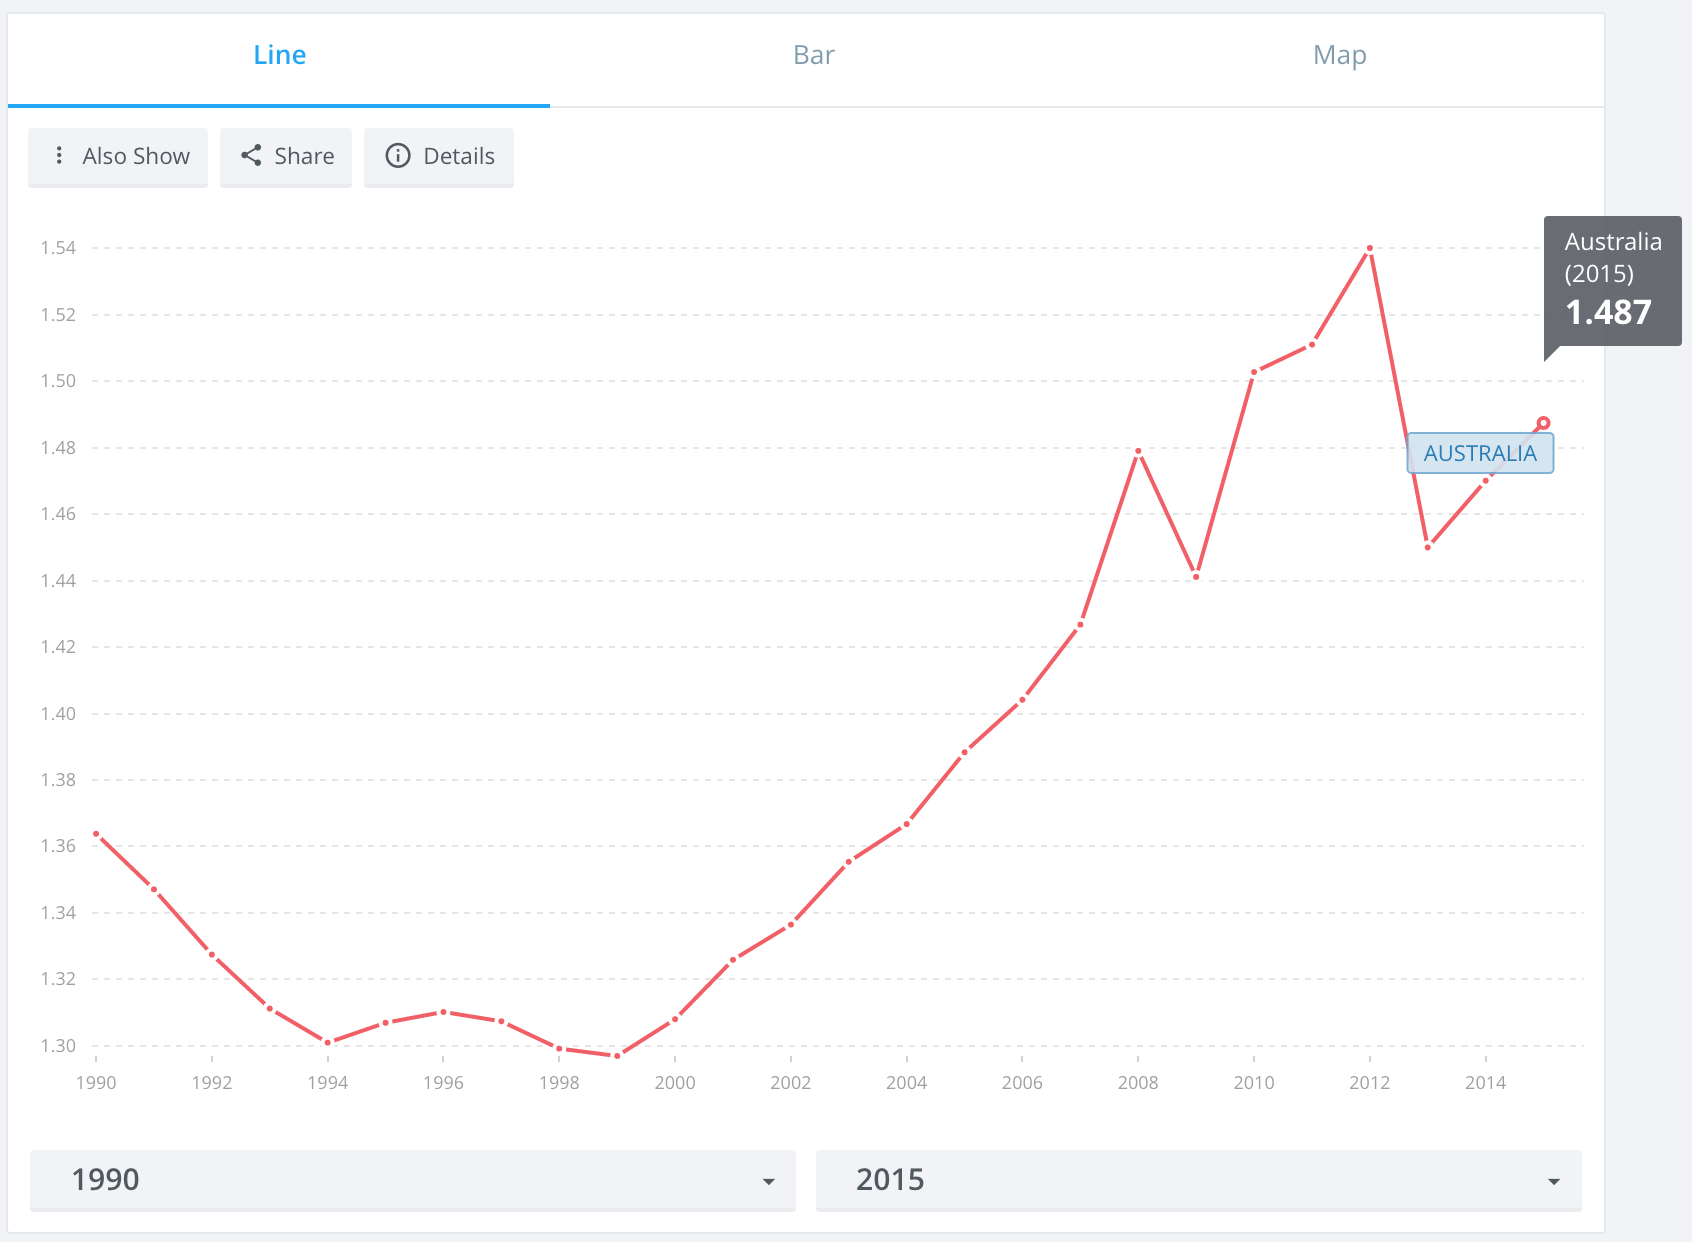
Last week another Australian I know in DC was surprised to see that the International Comparison Program’s (ICP) 2015 PPP exchange rate for Australia is 1.487. Are things really 50% more “expensive” (dollar for dollar) in Australia, he wondered?
I started to respond to this by collecting a few representative prices, but very quickly realized I might as well construct my own PPP index.
It turns out that if you try to measure PPP rates, you very quickly find yourself having to make many, small, important decisions. For example, if we’re comparing Thailand and Italy, should we include rice or flour in the basket? Or both?
There’s no better way to get a feeling for this, than to try it. If I were teaching a course on international economics, I think I’d get all my students to do this as an exercise.
DIY Purchasing Power Parity in 60 minutes or less #
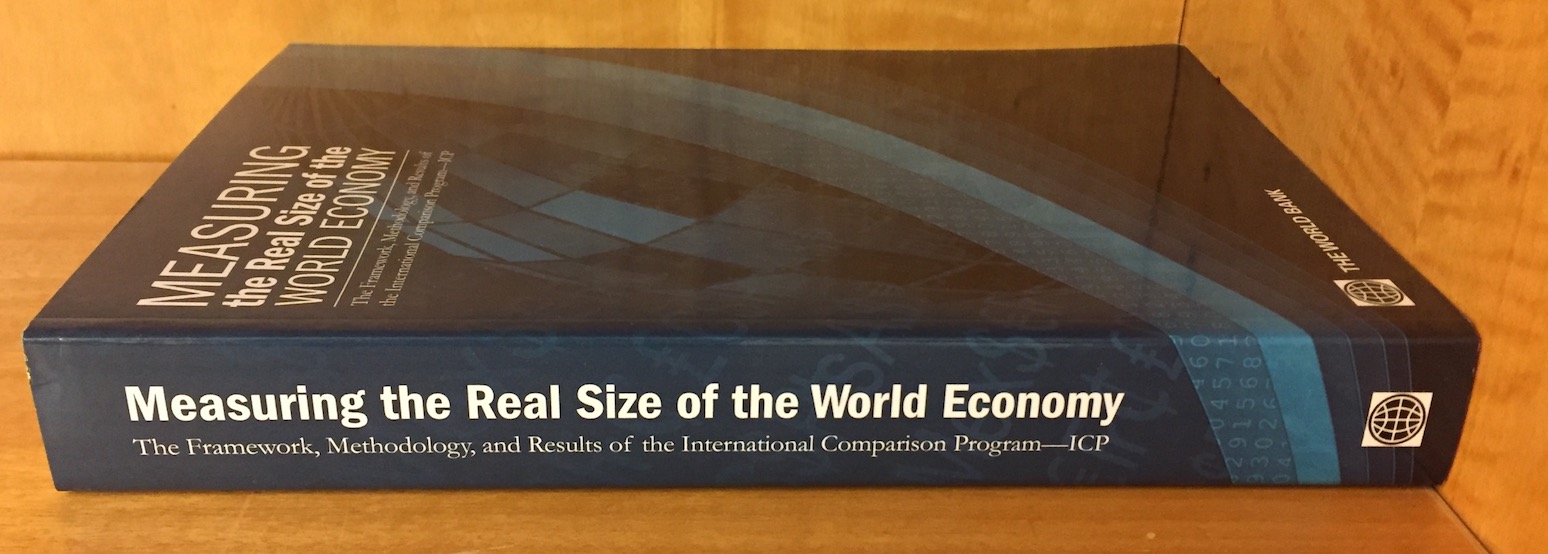
There is a right way to measure PPP. The ICP Book, pictured above, is almost 700 pages. But we have only one hour (yes, this is the weirdest episode of 24 ever). We probably can’t read the Introduction in that time, let alone calculate anything.
Like a statistical Jack Bauer, we’re going to have to grit our teeth and skip some steps. (Squeamish statisticians might like to tune out now.)
1. Choose two countries that are economically similar #
Trust me, this whole thing is going to be much harder if you want to compare Somalia with Luxembourg. I chose Australia and the USA.
Take pity on the ICP team—they have to come up with PPPs that can make sensible comparisons between many countries with very different economies.
2. Establish a basket of goods #
Find a breakdown of expenditure on different good and service categories. You should really care that your two countries will have different expenditure profiles. You should really consider how government consumption is or isn’t included. Don’t! Remember, the clock is ticking. I chose to use the US BEA’s latest Table 4.5: Personal Consumption Expenditures by Type of Product.
This is technically a “Laspeyres-type” index. The ICP uses indices with nicer properties (e.g based on both countries’ expenditure profiles).
3. Decide on a reasonable level of disaggregation #
The more granular your analysis, the better your answer. But collecting prices takes ages. Choose a dozen categories, max. Ideally disaggregate the big ticket items. Make sure you don’t leave anything out, but don’t overthink this.
This is roughly equivalent to what the ICP calls “main aggregates”, with “basic headings” below that and “products” at the bottom.
4. Find the price for a representative product in each chosen category #
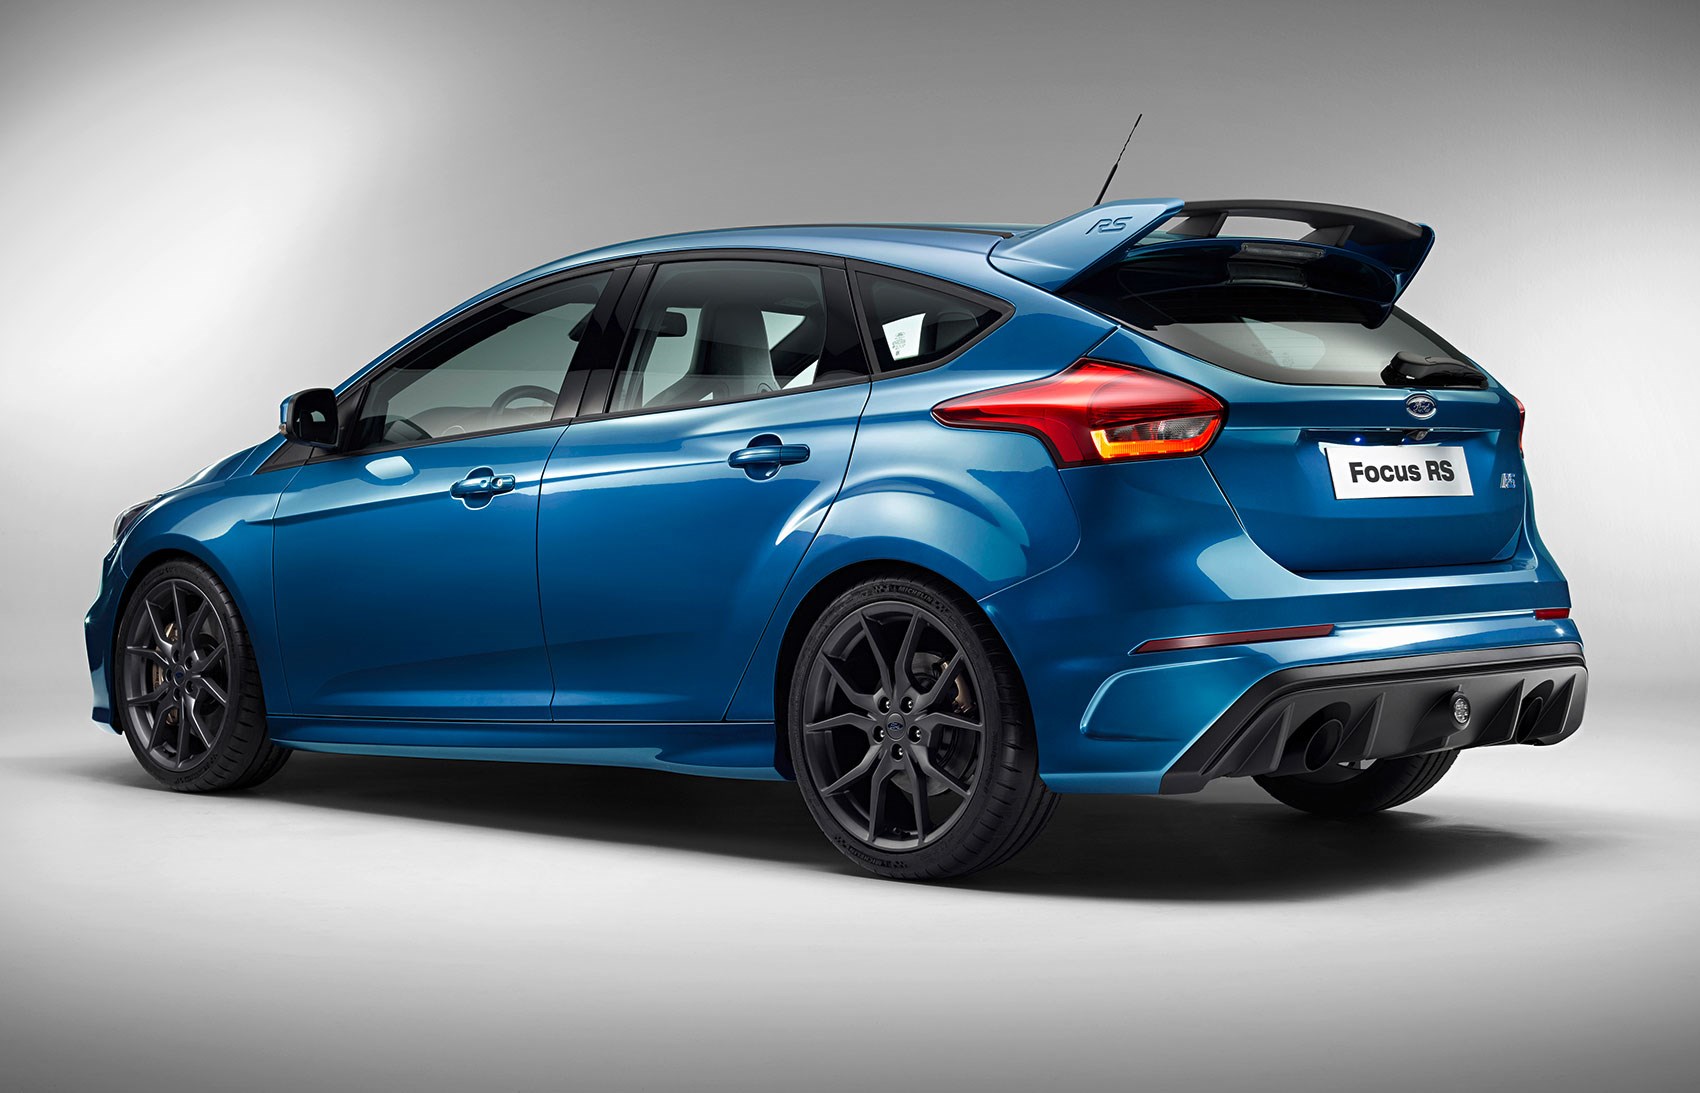
A good approach is to find the largest subcategory in the category, then pick a product from that. If the subcategory is tradeable, then you can probably find an exact product that is available in both countries (e.g. “2016 Ford Focus RS”. Probably “Bugatti Veyron” is also available in both countries but seriously we don’t have time for this, pick something people actually buy). If not, you’re going to have to go for something more generic (“Oil change”).
Some of these are going to be tricky. What’s a more representative pharmaceutical product, off-the-shelf generic ibuprofen (10c per dose) or prescription-only name brand Crestor ($8 per dose)? Does it matter that Australia has a single-purchaser arrangement for prescription drugs and the USA doesn’t? Stop sweating the details—you have about 20 minutes left! If any are really too difficult, make an assumption or drop them from the basket.
The ICP also has this concept of a “representative product”. Some of the difficult categories—health, education, rents—are what ICP calls “comparison-resistant basic headings”.
4a. Adjust for quantity differences (if necessary) #
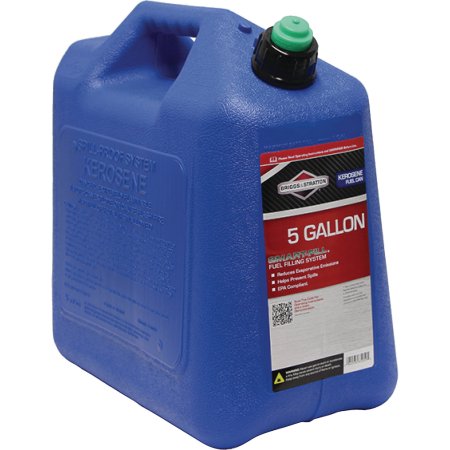
Practically all of the world’s 200 odd countries have adopted the metric system. Three haven’t. If one of your countries sells petrol/gasoline in gallons, quarts, pints, fluid ounces, teaspoons or the teardrops of official statisticians, you’re going to want to deal with that.
(What about quality differences? Isn’t an Arizona McMansion better than a mouldy London flat? Isn’t AFL just more entertaining than baseball? You’re really not getting this, are you? Move on.)
5. Take price ratios, apply expenditure weights, sum, voila: PPP #
Find the price ratio for each representative product. Take the sum of these ratios, weighted by your basket weights. That’s your PPP exchange rate.
ICP uses considerably more complicated methods of weighting and aggregation, but the principle is the same.
Did it work? Mine did: it came to 1.49, around 2% off the ICP number. I promise I didn’t cheat—you can see my working here (and linked below). I also tried it for the UK and got 0.72, about 4% off the official 0.69.
Unsurprisingly, The Economist’s Big Mac index, based on a single product, does much worse—23% and 14% error for Australia and the UK respectively. (Still, I guess if you only had 60 seconds to estimate PPP, you could do worse.)
 “Bauer here. Get me the Bureau… No, of Economic Analysis.”
Working #
Direct link to spreadsheet on Google Sheets.
Add comment
Comments are moderated and will not appear immediately.