Multi-color text in ggplot2
Occasionally when producing charts, it’s helpful to plot a single text element in multiple colors. Here’s an example of labels from the SDG Atlas where we used multiple colors to good effect to make labels for “Bangladesh” and “United States” clearer (I’ve darkened some parts of the chart to make the relevant labels clearer):
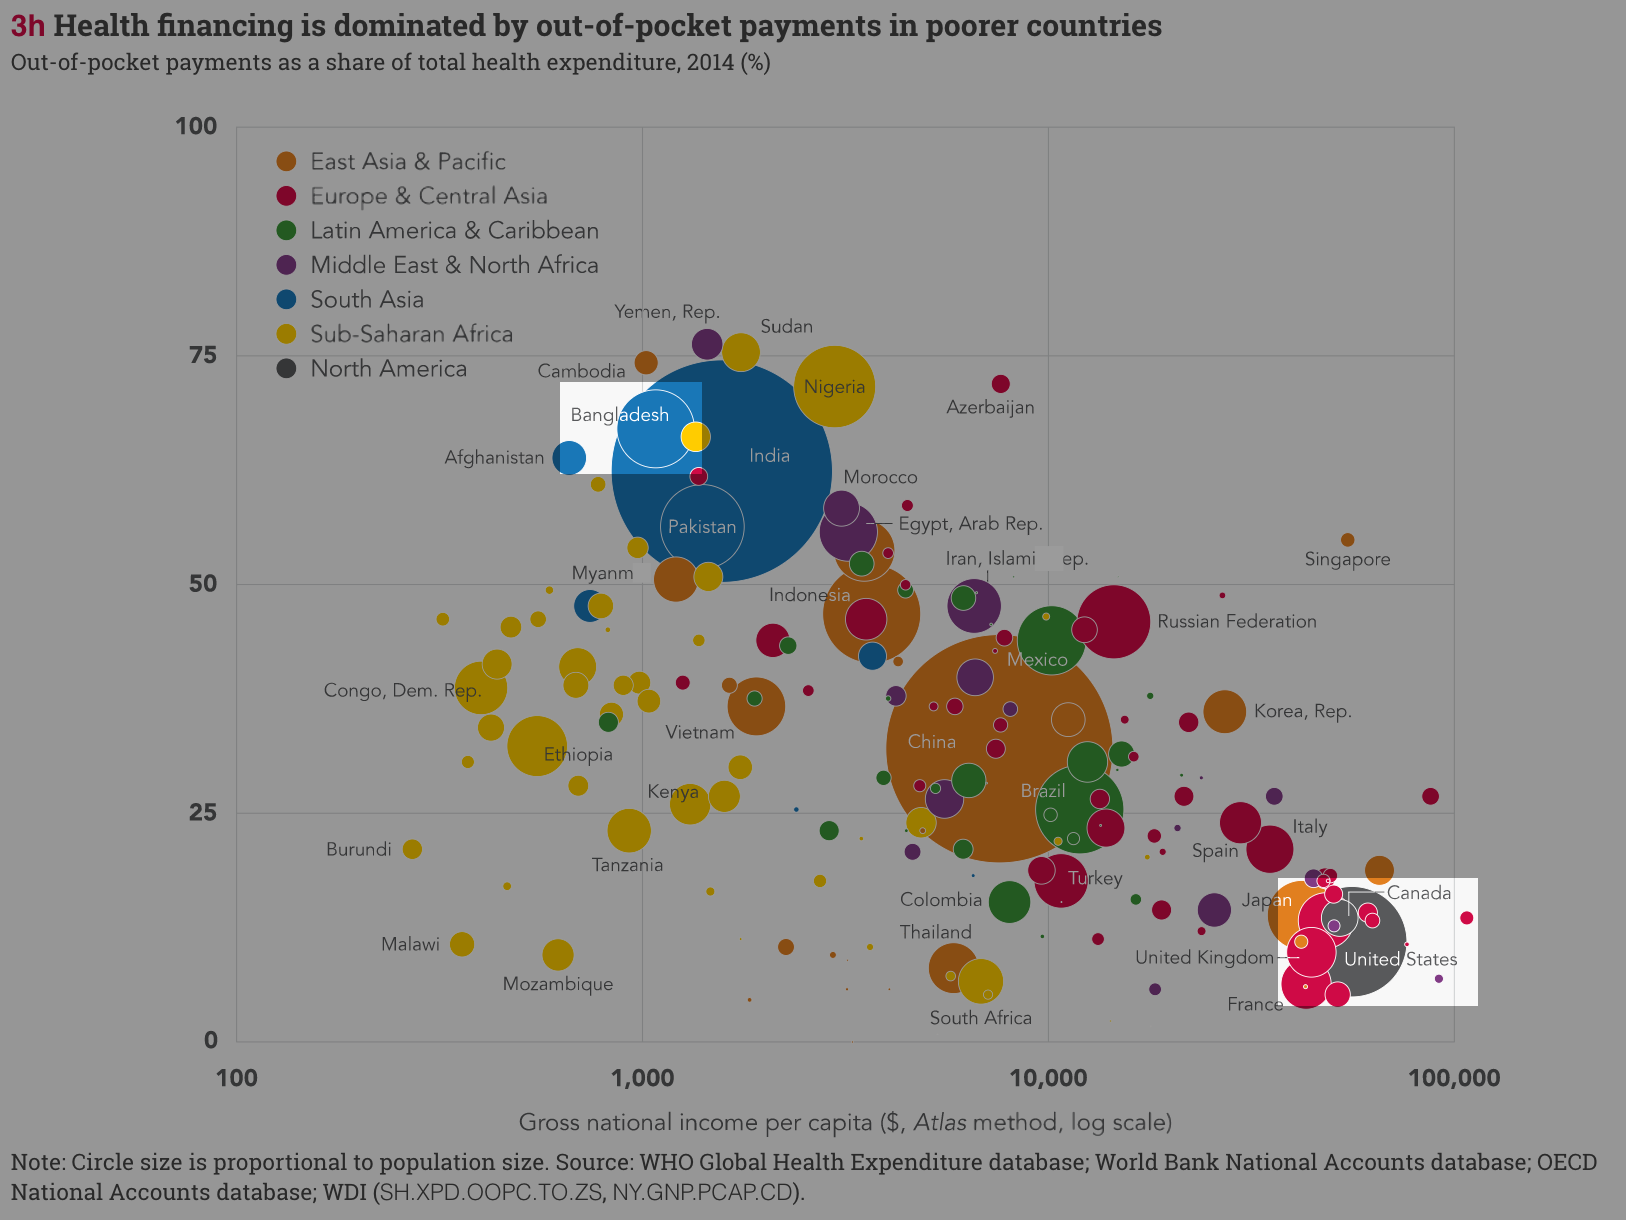
I say “we”. Actually, this is the kind of thing that was handled by the graphic designers we worked with, presumably using some Illustrator magic. I like it, and think it is a good labelling technique to have in your toolkit, when used in moderation as it is here.
The question is: can we do the same in pure R/ggplot2, in order to script more steps in our dataviz production? (Of course pleasing labelling in ggplot2 is itself a massive problem, but I’m working on that.)
You might think you could just paint the two halves of the label (e.g. “Bangl” & “adesh”) separately as different labels, but that won’t work: ggplot2 doesn’t give you pixel-level control over where things end up, so it’ll be near-impossible to align the two halves.
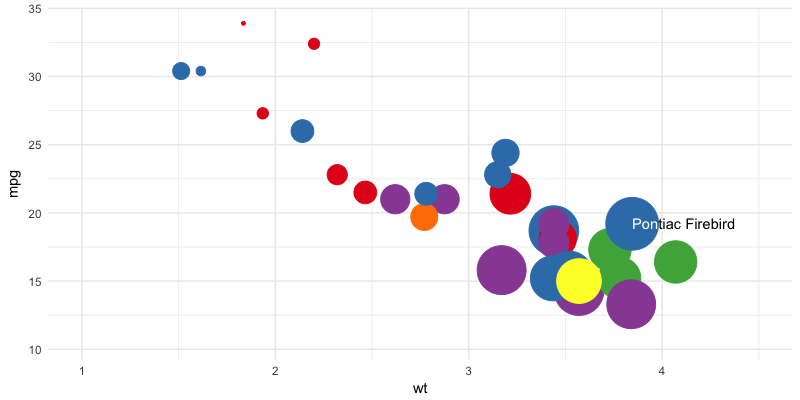
Instead what we can do is print the label twice, as follows:
annotate("text", x = firebird$wt, y=firebird$mpg, hjust = 0,
         label="Pontiac Firebird", color="black") +
annotate("text", x = firebird$wt, y=firebird$mpg, hjust = 0,
         label="Pon", color="white")
Of course this may not always work. One could imagine in some output formats overprinting will change the appearance of the text (though svg() looked ok). Or what if you have hjust = 0.5 for centered labels?
For a more generalisable technique, we can adapt an idea described here for base graphics. The key is that geom_text & co take a ‘parse’ argument, which parses plotmath expressions. So rather than splitting the label in two, we
annotate("text", x = firebird$wt, y=firebird$mpg, hjust = 0, parse=T,
         label='"Pon" * phantom("tiac Firebird")', color="white") +
annotate("text", x = firebird$wt, y=firebird$mpg, hjust = 0, parse=T,
         label='phantom("Pon") * "tiac Firebird"', color="black")
It’s still quite fiddly, and obviously fragile (in the sense that if things move around at the pixel level, the different parts of the label will likely end up in the wrong place). But it is possible!
The full gist is available here.
Add comment
Comments are moderated and will not appear immediately.
Comments (4)
How would you write this as a function for strings of any length? I’m in the process of trying to write one where I specify the color of each word, but I’m finding it quite difficult to do. It seems like it would be quite valuable to have a function that allows easy coloring of text, rather than having a different annotate() function for every color you need.
Already figured out how to do it. Will make a post on Reddit / wordpress with the code after making it more robust.
Great! If you can, post a link here when you’ve done it so anyone else with the same problem can follow this thread to your solution.
https://visuelledata.netlify.com/2017/10/20/2017-10-20-colorful-plot-annotations/
Here you go! The function is at the bottom of the page if you don’t want to read everything.